This report shows the evolution of the analog input, in a graph, for the selected vehicles and time period.
Configuration
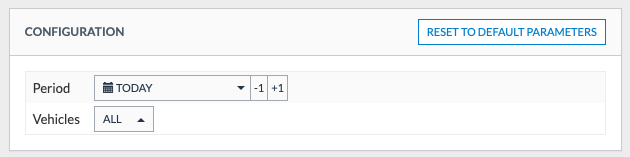
To generate the report, you must configure the following inputs:
| Configuration | Description |
| Period |
The period the report will be generated for. Options:
|
| Vehicles | Select here the vehicles the report will be generated for, or choose All vehicles for the whole fleet (Default: all vehicles) |
Output

The output of this report is a graph for each selected vehicle, for the selected period.
It contains the following information:
| Information | Description |
| Vehicle | License plate of the vehicle |
| Driver | Name of the driver that drove the vehicle in period. |
| Start report period odometer | The odometer the vehicle had at the beginning of the selected period selected. |
| End report period odometer | The odometer the vehicle had at the end of the selected period selected. |
| Graph |
Represents the oscillations that happen to the analog input selected. The unit of measures is time/date in the X axis and Voltage in the Y axis. The analog input is manually selected by the FCP in the Intranet. |